K12 Excellence
We delivered enterprise-grade analytics platforms for two of Texas’s largest urban school districts - giving every stakeholder from student to superintendent the right data to make faster, better decisions.
Enterprise Analytics
for K–12 Education
K12 Excellence applied the same data engineering rigor that drives Fortune 500 decision-making to public education. RiTek designed and delivered multi-tier dashboard platforms on industry-leading BI tools, transforming raw district data into actionable intelligence for every role in the organization.
Our platforms served nightly-refreshed data from enterprise data warehouses across multiple source systems - SIS, finance, HR, assessments - aggregated and role-secured so each user saw exactly what they needed and nothing more.
Built with FERPA compliance at the foundation, role-based security enforced down to the student record, and mobile-responsive design that worked in the classroom, the office, or at home.
Houston Independent School District
RiTek designed and delivered the A4E (Analytics for Education) platform for HISD - a comprehensive multi-dashboard system serving principals, teachers, achievement staff, chief school officers, board members, and students across one of the largest urban school districts in the United States.
Dashboard screenshots are representative samples from test and demonstration environments. They illustrate the type of analytics delivered for Houston ISD and Dallas ISD and do not depict real student records, personnel data, or live district metrics.
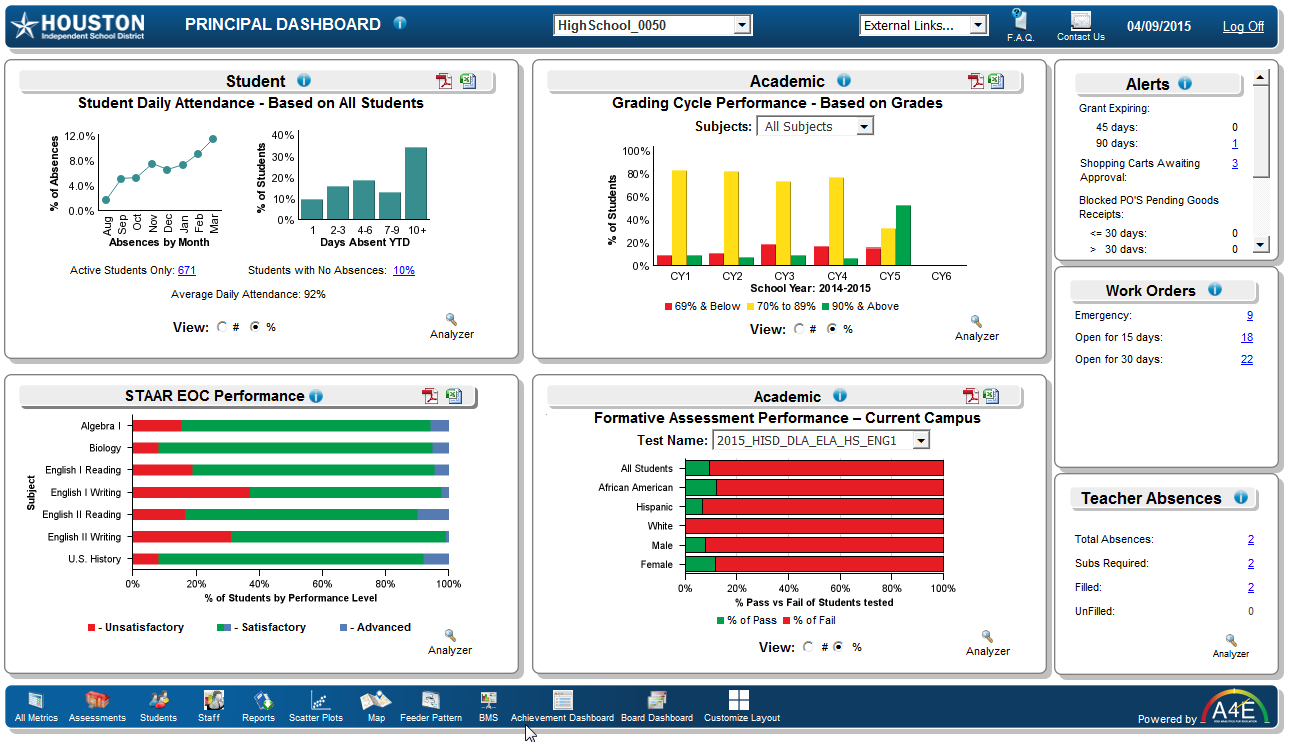
Principal Dashboard
The flagship dashboard organized around four quadrants: Student (attendance trends, absences by month), Academic (STAAR EOC by subject, grading cycle performance, formative assessment results by demographic), Staff (teacher effectiveness, absences, substitutes), and Finance (budget, grants, work orders). Operational alerts surfaced critical issues - expiring grants, pending POs, shopping cart approvals - directly on the principal’s home screen.
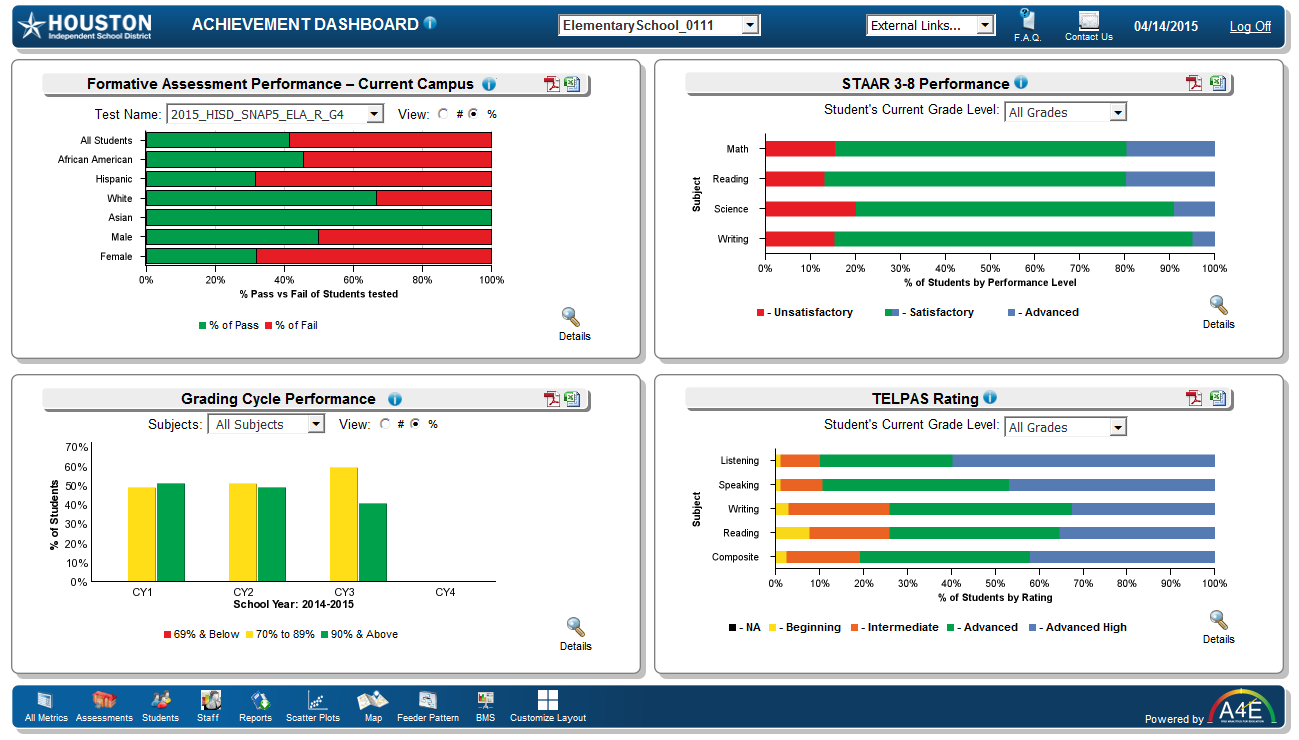
Achievement Dashboard
Designed for non-instructional campus staff - coordinators, specialists, interventionists, and counselors - this dashboard surfaced Formative Assessment Performance broken down by demographic group (African American, Hispanic, White, Asian, Male, Female), STAAR 3–8 performance by subject across performance levels (Unsatisfactory, Satisfactory, Advanced), Grading Cycle trends over the school year, and TELPAS ratings (Listening, Speaking, Writing, Reading, Composite) for ELL students.
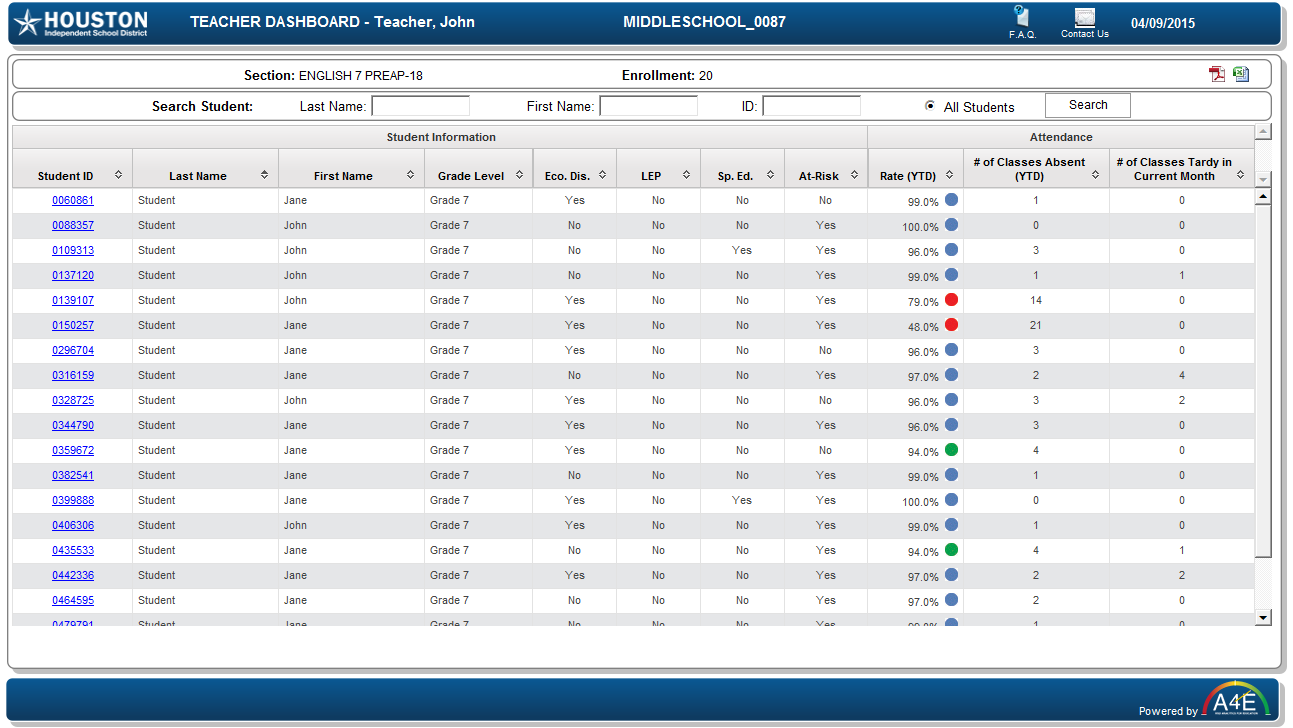
Teacher Dashboard
Deliberately lean and focused on what teachers need most: a searchable class roster with per-student flags for At-Risk, LEP, Special Ed, and Economic Disadvantage, alongside attendance rate YTD, absences, and tardies. One-click drill to STAAR reports, Student Profile, Istation results, SRI scores, EdPlan data, and the Early Warning Indicators analyzer. Available for each section the teacher instructs, with enrollment counts and all key identifiers visible at a glance.
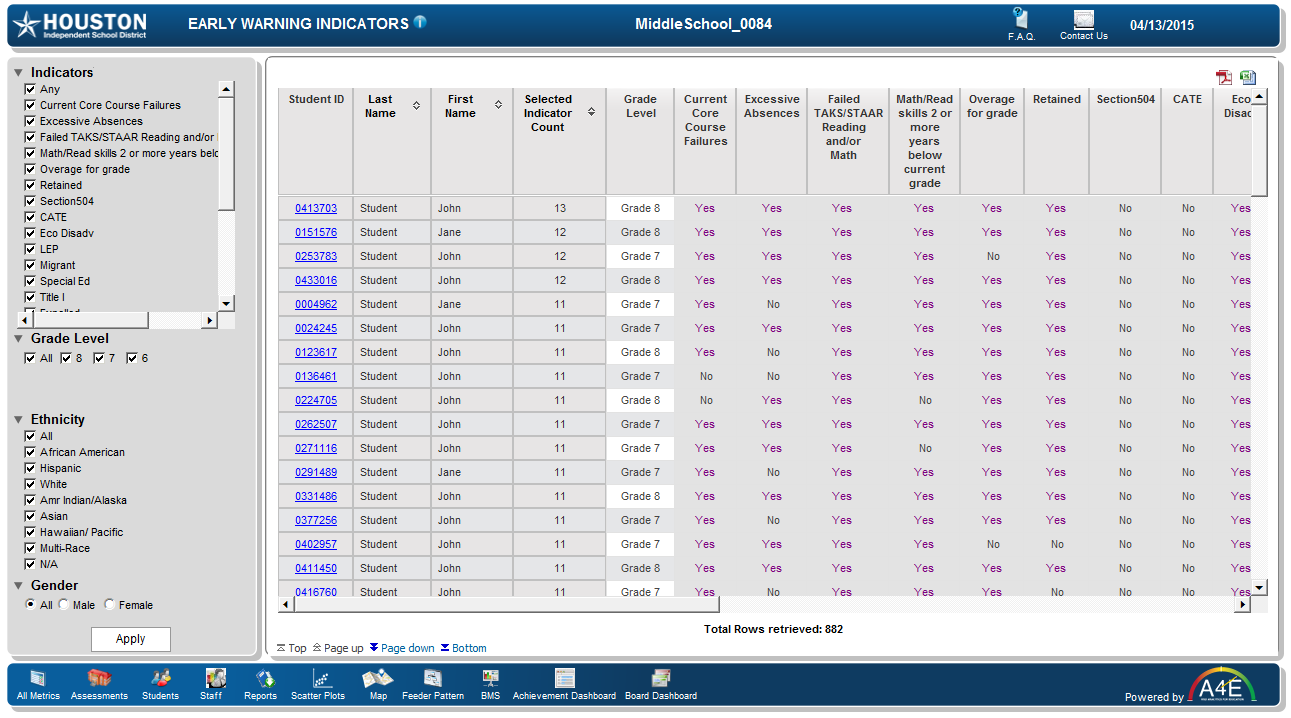
Early Warning Indicators Analyzer
One of the platform’s most impactful tools: an analyzer that scored every student against 25+ at-risk indicators - excessive absences, current core course failures, failed TAKS/STAAR reading and math, math/reading skills 2+ years below grade, overage for grade, retained, Section 504, CATE, LEP, Migrant, Title I, Special Ed, and more. Students were ranked by total indicator count and filterable by grade level, ethnicity, and gender, allowing staff to prioritize outreach before students fell too far behind to recover.
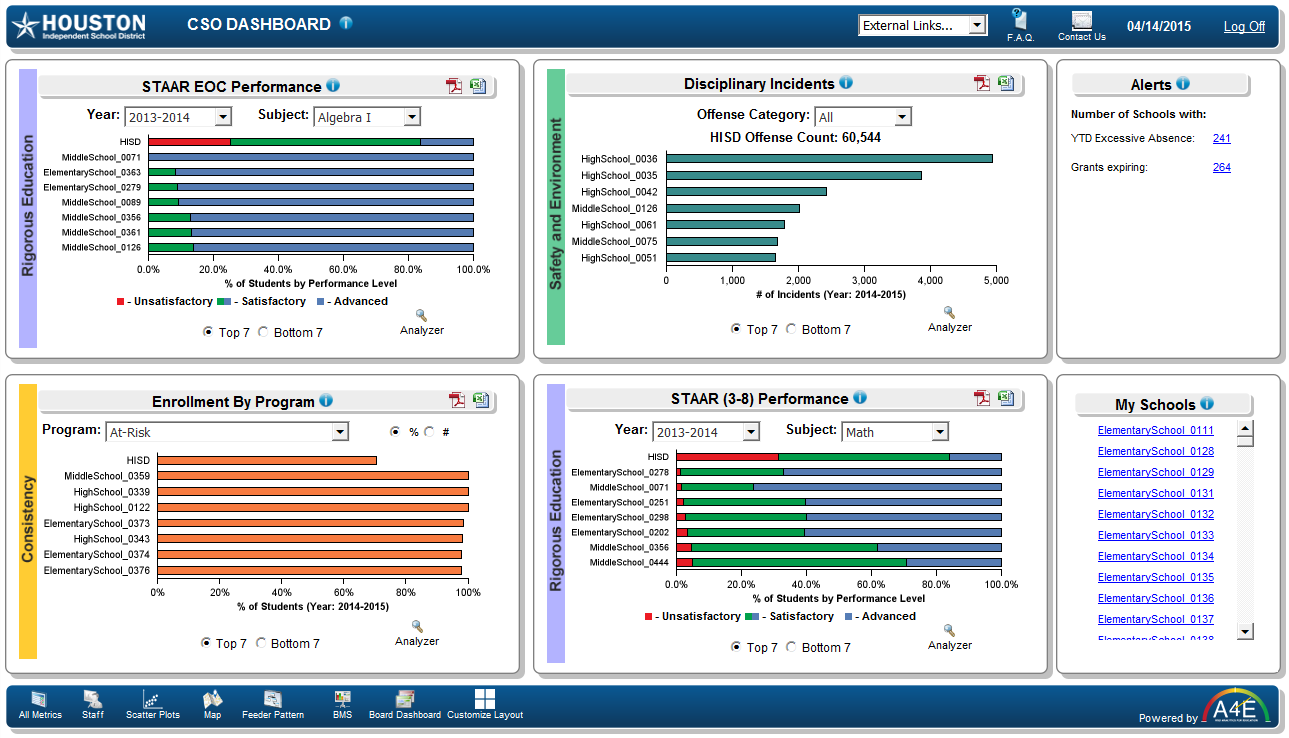
Chief School Officer (CSO) Dashboard
An executive-level view for district leadership: top and bottom 7 schools ranked on STAAR EOC performance by subject (Algebra I, Biology, ELA, U.S. History), Disciplinary Incidents by campus with HISD-wide offense totals, Enrollment by Program (At-Risk, SPED, LEP, Gifted & Talented) across schools, and comparative STAAR 3–8 performance by subject. The “My Schools” panel gave each CSO a quick-launch list of their assigned campuses. Organized around HISD’s strategic pillars: Rigorous Education, Consistency, and Safety & Environment.
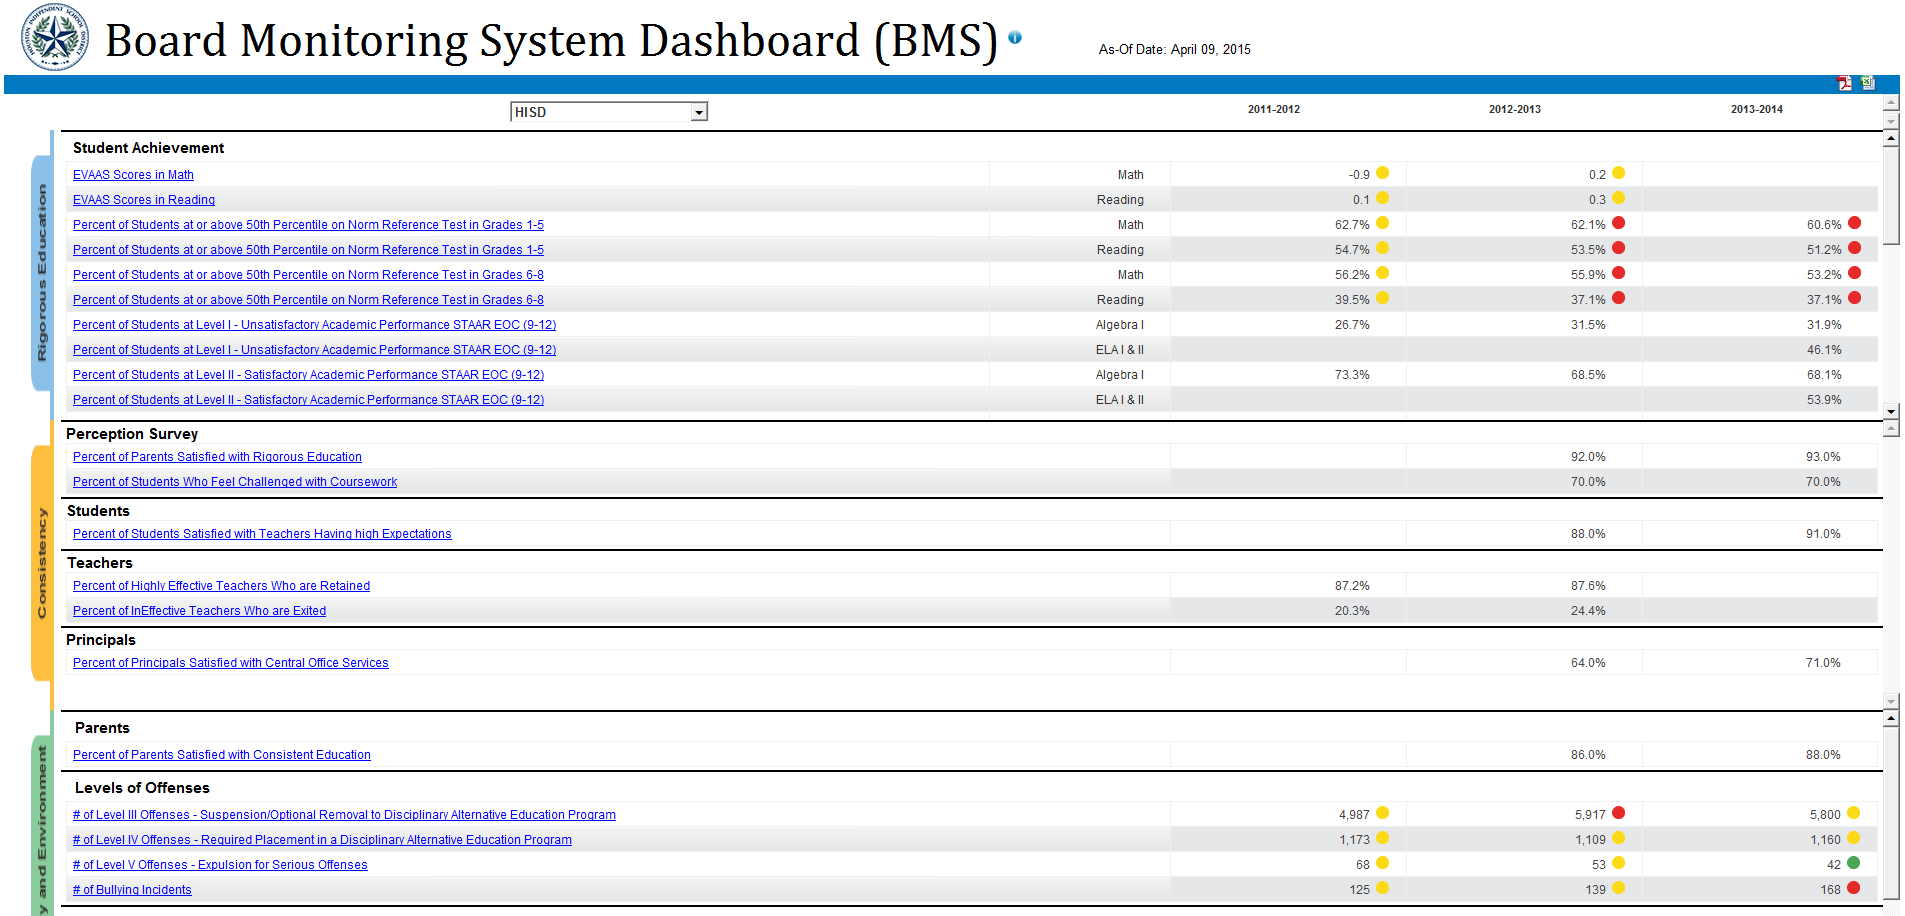
Board Monitoring System (BMS) Dashboard
The governance layer of the platform: a comprehensive scorecard tracking HISD Board of Education performance metrics across multiple school years. Metrics were organized by strategic category - Rigorous Education (EVAAS scores, norm reference test percentiles, STAAR EOC passing rates), Consistency (teacher effectiveness and retention, principal satisfaction, parent perception surveys), and Safety & Environment (Level III–V disciplinary offenses, bullying incidents). Color-coded indicators (green/yellow/red) gave board members an instant status read across the district’s most important measures.
Student Profile
A complete single-student view aggregating data from across the district: Demographics (ethnicity, grade, economic disadvantage, LEP, gifted & talented, Special Ed, at-risk status), Content Knowledge with STAAR 3–8 raw and scale scores, Academic Behavior (estimated overall grade performance, failing cycle grades, attendance rate YTD, excused and unexcused absences), Current Course Schedule with per-course grade performance indicators, and full Campus History including entry/exit dates and enrollment status across all campuses attended.
Dallas Independent School District
Presented at the TASA Mid-Winter Conference in 2011, the K12 Excellence platform for Dallas ISD delivered role-layered analytics from the classroom to the boardroom - each dashboard purpose-built for the decisions its audience needed to make.
Dashboards Delivered for DISD
Teacher Dashboard
Grade averages by grading cycle with year-over-year comparison, class attendance by marking period, at-risk student counts, discipline summary, and custom report links for class GPA, attendance, demographics, and all-student lists.
Principal Dashboard
Operational alerts, discipline by offense type, historical TAKS performance by school year and achievement level, teacher performance detail, marking period comparisons, school rank within district (e.g., 12 of 134), and school performance vs. all schools of the same type.
Superintendent Dashboard
Multi-year trend lines for HS Graduation Rate, % Enrolled in College, College Graduation Rate, % On Track, and % College Ready. School district comparison views with side-by-side line graphs across selected student groups and measures.
Trustee Dashboard
TAKS accountability view with percentage of students meeting standards or commended, filterable by ethnicity, subject, and grade level. Geographic school locator map with performance alerts summarized by campus group. Achievement alerts with drill-down to school-level detail.
High School Performance Indicators
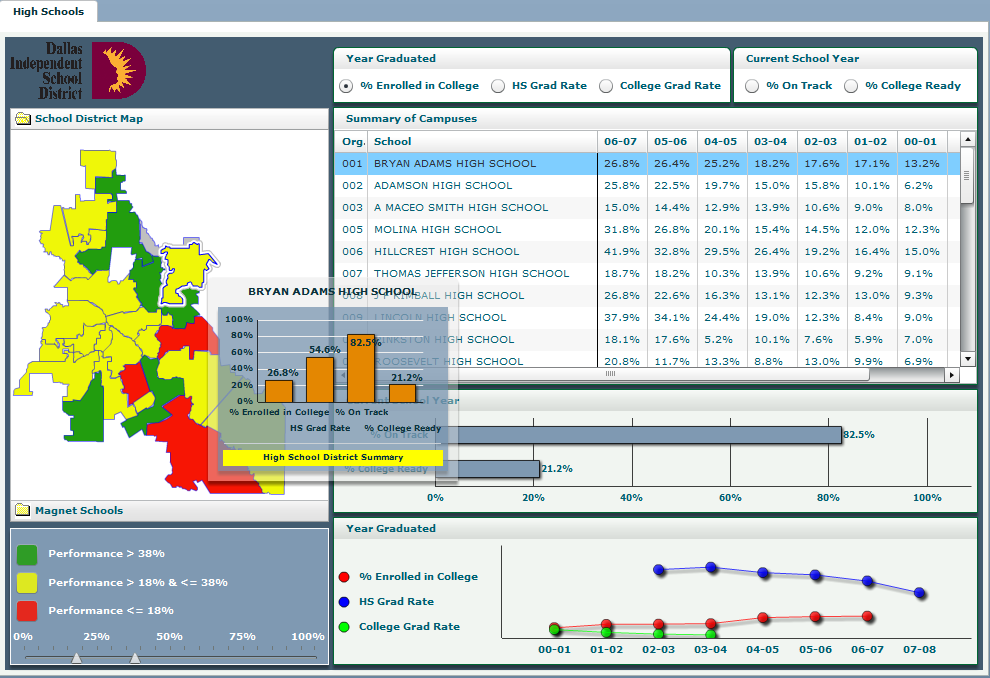
A geographic campus map color-coded by performance band (green >38%, yellow 18–38%, red ≤18%), a summary table of all high schools with 7+ years of historical performance data, and trend lines tracking graduation rates, college enrollment, and college completion over time.
Client references available upon request.
Every Role. Every Layer. Every Decision.
The K12 Excellence platform covers the full district hierarchy - from an individual student’s academic record to board-level governance metrics - with purpose-built views for each audience.
Student Dashboard & Profile
Personal attendance trends, grades by marking period, standardized test scores (STAAR, TAKS, TELPAS, AP, PSAT, ACT), and a full campus history. Students see their own data; staff see the complete profile.
Teacher Dashboard
Class rosters with at-risk, LEP, Special Ed flags, attendance rates, and per-student drill-down to STAAR reports, Istation, SRI, and EdPlan data. Focused on the questions teachers ask every day.
Principal Dashboard
Attendance, academic performance, formative assessment results, STAAR EOC, budget and grants, work orders, teacher absences, operational alerts - the full campus picture in a single screen, with analyzers for deeper investigation.
Achievement Dashboard
Purpose-built for interventionists, counselors, coordinators, and campus support staff. Formative assessment performance by demographic group, STAAR 3–8 by subject, grading cycle trends, and TELPAS language proficiency ratings.
Early Warning Indicators
25+ multi-factor risk indicators scored per student - absences, course failures, STAAR gaps, overage, retention, LEP, Section 504, and more. Students ranked by risk count with filters by grade, ethnicity, and gender to focus intervention resources where they’re needed most.
Parent Portal
FERPA-compliant parent access to their child’s attendance, grades, detailed assignment descriptions, standardized test scores, school events, bus schedules, and lunch menus - with secure single sign-on and mobile-friendly design.
Superintendent & Administrator Dashboard
District-wide performance views with multi-year trend lines for graduation rates, college enrollment, and readiness indicators. School district comparison views, enrollment by program, and financial oversight across the entire organization.
CSO Dashboard
Chief School Officers see their assigned campuses ranked top-to-bottom on key metrics: STAAR EOC by subject, disciplinary incident counts, at-risk enrollment by program, and STAAR 3–8 by grade. Organized around the district’s strategic pillars of Rigorous Education, Consistency, and Safety & Environment.
Board & Trustee Dashboard
Governance-level metrics tracked year over year across the Board’s declared performance standards. Geographic school maps with color-coded performance status, feeder school analyzers, BMS metrics with district vs. campus breakdowns, and the accountability reporting trustees need to fulfill their oversight role.
K12 ParentView - Ready for Your District
Beyond our custom district engagements, K12 Excellence offers K12 ParentView - a packaged Software-as-a-Service platform that any school district can deploy without a full custom build. It delivers the same role-stratified analytics experience in a ready-to-configure cloud product.
K12 ParentView covers every constituency in the district ecosystem, each with a tailored view of the data that matters to them - connected to your SIS and delivered securely over the web.
Why K12 ParentView?
- Faster time to value than a custom build
- Role-based access enforced from day one
- FERPA-compliant architecture built in
- Integrates with major SIS platforms
- Mobile-responsive across all devices
- Configurable branding and content per district
Built Like Enterprise.
Designed for Education.
K12 Excellence applied enterprise data engineering discipline to a domain that had historically lacked it. Every dashboard was built on a nightly-refreshed Enterprise Data Warehouse, pulling from multiple source systems through a governed ETL pipeline - the same architectural pattern used in enterprise BI, applied to the complexity of district data.
Statistical & Predictive Analysis
Early warning systems that identified at-risk students before they fell too far behind, scoring each student against 25+ multi-factor indicators updated nightly.
Security by Design
Role-based access tied to HR job titles, enforced at the data layer. Each user saw only their scope - principals their campus, trustees their region, teachers their classes - with exception access requiring Chief approval.
Stakeholder-Led Design
Dashboards evolved through principal, teacher, and administrator focus groups, then a steering committee representing all stakeholder types - ensuring each view reflected how users actually made decisions, not just what data was available.